Blog: The Victory Formula: A Data-Driven Model for General Election Success
General elections are frequently discussed, but rarely understood.
Commentary about general election outcomes often resorts to pointing fingers and saying “I told you so,” instead of focusing on available data and objective facts. We believe that the largest contributing factor to this unfortunate phenomenon is the lack of a data-driven model capable of explaining general election outcomes.
For this reason, we’ve developed such a model. This model can be expressed in two different ways: (1) qualitatively in a three-layer model for abstract discussion, and (2) formulaically for precise calculations.
Let’s start with the qualitative three-layer model. As shown in the diagram below, the base of this model is Voter Registration, followed by Turnout, and finally topped with Support.
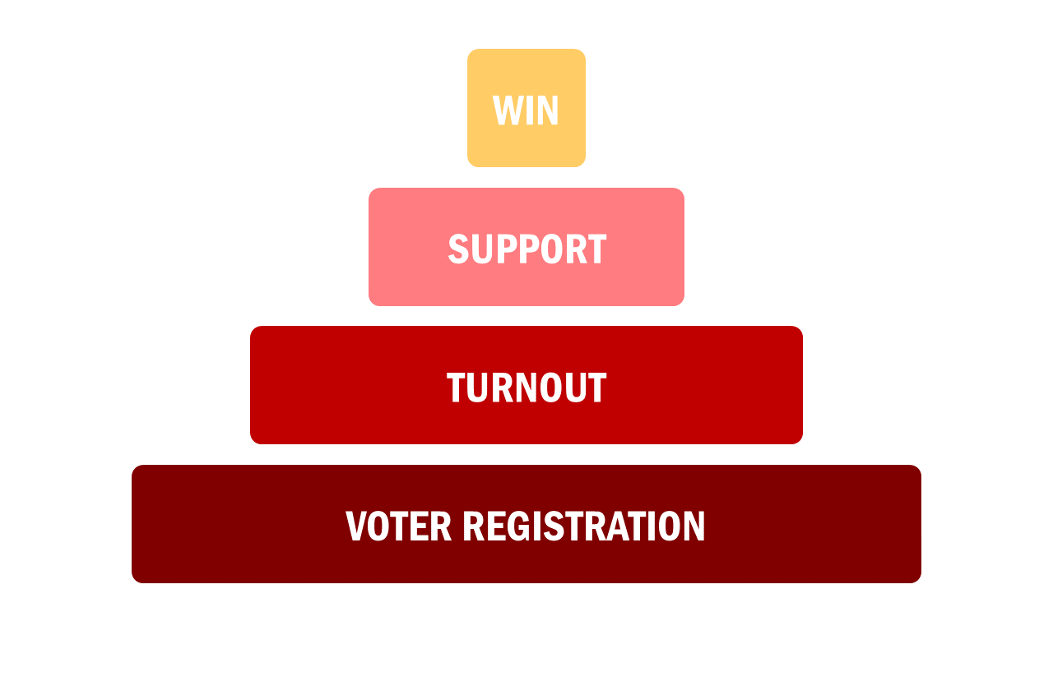
Voter registration is the core of a party’s political operation. Without registered voters, turnout is impossible, and without turnout, winning support for the party’s candidate is impossible. For this reason, voter registration lies at the base of our model. However, it’s important to note that our model factors in the percentage of voters registered with each party, not just the absolute number. In other words, to make a positive difference, a party’s voter registration efforts must outpace the other party’s efforts.
One step up from voter registration is turnout. Our model factors in turnout on a party-by-party basis. For example: “68% of Republicans voted in the election, compared to 55% of Democrats and 39% of nonpartisans and third-party voters.”
The final step in the model is support. Support refers to the actual votes that the party’s candidate receives. In our model, support comes from three sources: partisan loyalty, partisan crossover, and nonpartisan breakers.
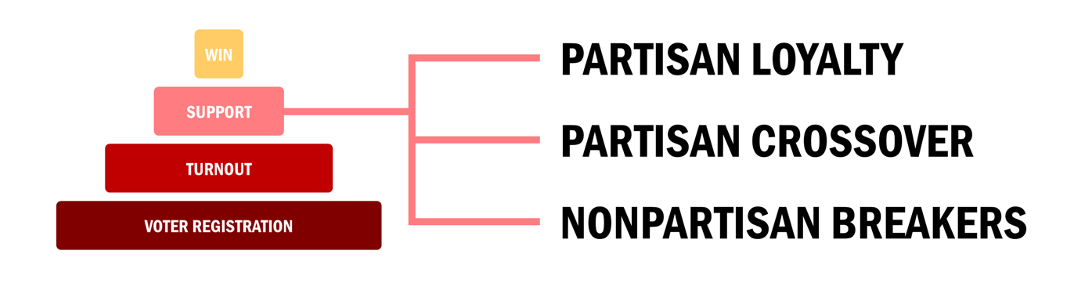
In our model, partisan loyalty refers to the percentage of a party’s voters who voted for the party’s candidate versus the opposing party’s candidate. For example, if 100,000 Republicans vote in the election, but only 80,000 vote for the Republican candidate, that translates to a partisan loyalty value of 80% for Republicans. So, votes from partisan loyalty are simply the votes received from members of a candidate’s own party.
Partisan crossover is essentially the opposite of partisan loyalty. It refers to votes received by a candidate from members of the opposite party. Again, this is represented in percentage form.
Finally, nonpartisan breakers are nonpartisan or third-party voters who vote for a party’s candidate. For example, let’s say 6,000 nonpartisan/third-party voters vote for the Republican candidate, while 4,000 nonpartisan/third-party voters vote for the Democratic candidate. In this case, 60% of nonpartisan breakers would “break” for the Republican candidate, while 40% would “break” for the Democratic candidate.
Using these three types of support – and factoring in the voter registration and turnout layers – we can calculate the exact margin of victory (or loss) for a party’s candidate. The formula below – the mathematical representation of our model – allows us to do just that for a Republican candidate (note: for a Democratic candidate, just replace the “R” variables with “D” variables, and vice versa).
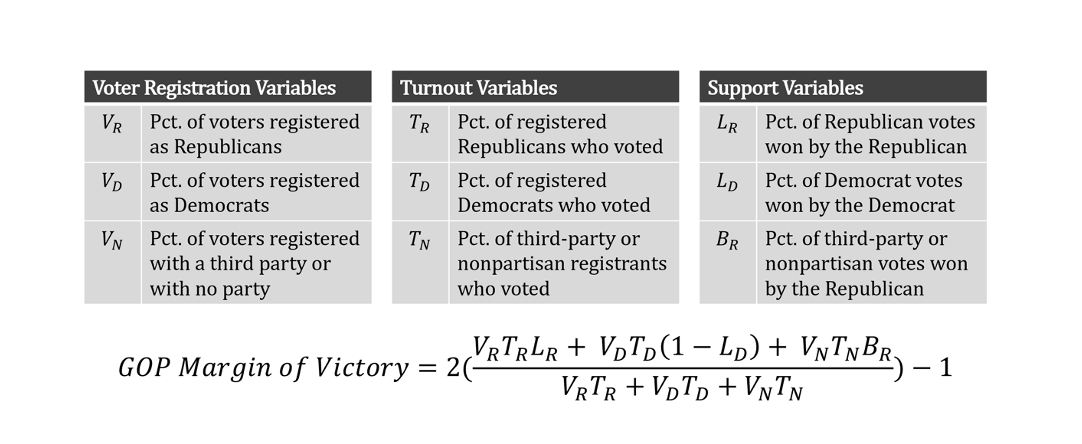
Essentially, the formula incorporates votes from each of the three types of support, divides those votes by total turnout, and then transforms the result to accurately represent the margin of victory. But now that we finally have the formula, you might be thinking: “Great, but how is this useful?” Good question. This formula can be used in a number of ways, some of which are listed below:
1. Retrospective analysis. With voter registration and turnout numbers easily at hand after an election, one can analyze the outcome of an election after the fact, diving deep into how registration, turnout, and/or candidate quality could have made a difference in an election. As an example, you can read our article “A Data-Driven Perspective on the Jacksonville Mayoral Race.”
2. Election forecasting. Using a combination of polling data, registration data, and partial turnout data, one could make predictions about the outcome of an election. In addition, one could test various scenarios (for example, high vs. low Election Day GOP turnout) and see how they would affect the outcome of the race.
3. Campaign viability analysis. This formula could be used to see which stars would need to align in order for a candidate to win his/her election. This analysis could be done on behalf of a prospective candidate considering entering a race, a PAC or donor considering whether to financially support a candidate, or even by a county or statewide party to determine which races to pour funds and get-out-the-vote efforts into.
Of course, there are some limitations to this model. It assumes a two-way, head-to-head, party vs. party race, which might not be the case in all states or situations. However, for most general elections, this model can be used as a framework for considering why things went – or will go – a certain way. Most importantly, it shifts the conversation from emotion-driven rhetoric to data-driven analysis.
That’s what we do here at Victory Insights. Interested in learning more?
Reach out to us today.