Blog: A Data-Driven Perspective on the Jacksonville Mayoral Race
In mid-May of this year, Florida politicos on both sides of the aisle turned their attention towards Duval County, where the race for Jacksonville Mayor was coming down to the wire.
Despite the fact that Democrats made up 4.3% more of the registered voter base than Republicans in Jacksonville, Republican turnout exceeded Democratic turnout by 3.2% by the end of Election Day. With turnout numbers tilted in their favor, Republicans were hopeful that their nominee, Daniel Davis, would come out victorious.
That didn’t happen. Instead, Democrat Donna Deegan won with 52.1% of the vote, besting Davis’s 47.9%. Despite strong Republican turnout – bolstered by the Florida GOP’s get-out-the-vote efforts – the Republican candidate had lost, and many on the right were left scratching their heads and asking, “What went wrong?”
In this article, we’ll be answering that question through the lens of the Victory Formula, a model developed by our team for the purpose of understanding general election outcomes. If you’d like to take a deeper dive into this formula, you can read this article explaining how it works. But for our purposes today, all you need to know is that the formula takes in nine variables (three about voter registration, three about turnout, and three about support for each candidate), and produces the exact margin by which a Republican candidate wins (or loses) a head-to-head general election.
Since the election in Jacksonville has already happened, we were lucky enough to have exact final numbers for voter registration and turnout, meaning all that’s left for us to understand is the layer we refer to as “support.”
This layer has three simple variables: Republican loyalty, Democratic loyalty, and nonpartisan loyalty. Republican loyalty refers to the percentage of Republican turnout that resulted in votes for the Republican candidate. For instance, if 100 Republicans voted in the election, but only 75 of them voted for the Republican candidate, then Republican loyalty would be 75%. Democratic loyalty refers to the same concept, just on the Democratic side. And finally, nonpartisan loyalty simply refers to the percentage of the nonpartisan/third-party that went to the Republican candidate.
None of these variables can be found in the election result data. Instead, we must use the Victory Formula to make inferences about their values, and from there, draw conclusions about why the race ended up the way it did. But there’s an issue: with three unknown variables, there are many different combinations that could result in Deegan’s 4.2-point victory. In fact, these potential “solutions” can be mapped out on a three-dimensional surface:
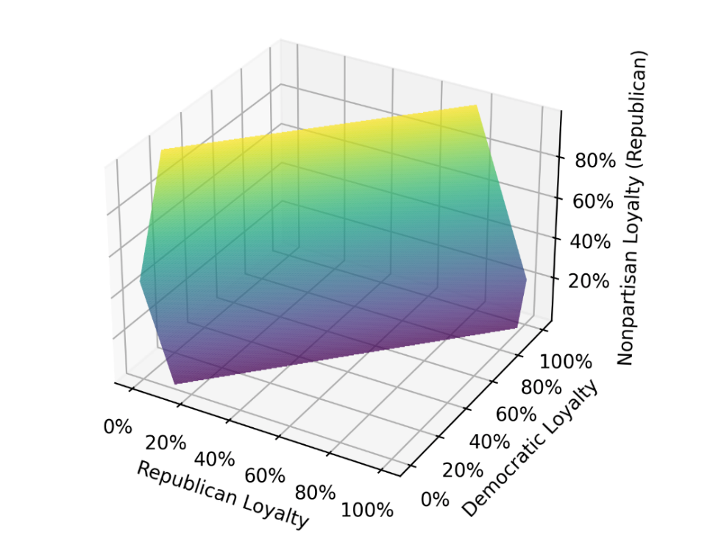
But this is entirely unhelpful. Besides the fact that representing a 3D object on a 2D screen is a tough task in and of itself, it’s hard to see where each point on the surface (i.e. each potential combination of values) lies. This makes it nearly impossible to draw informed conclusions from the chart. So, to make things simpler, we chose to represent the same data in the GIF below:

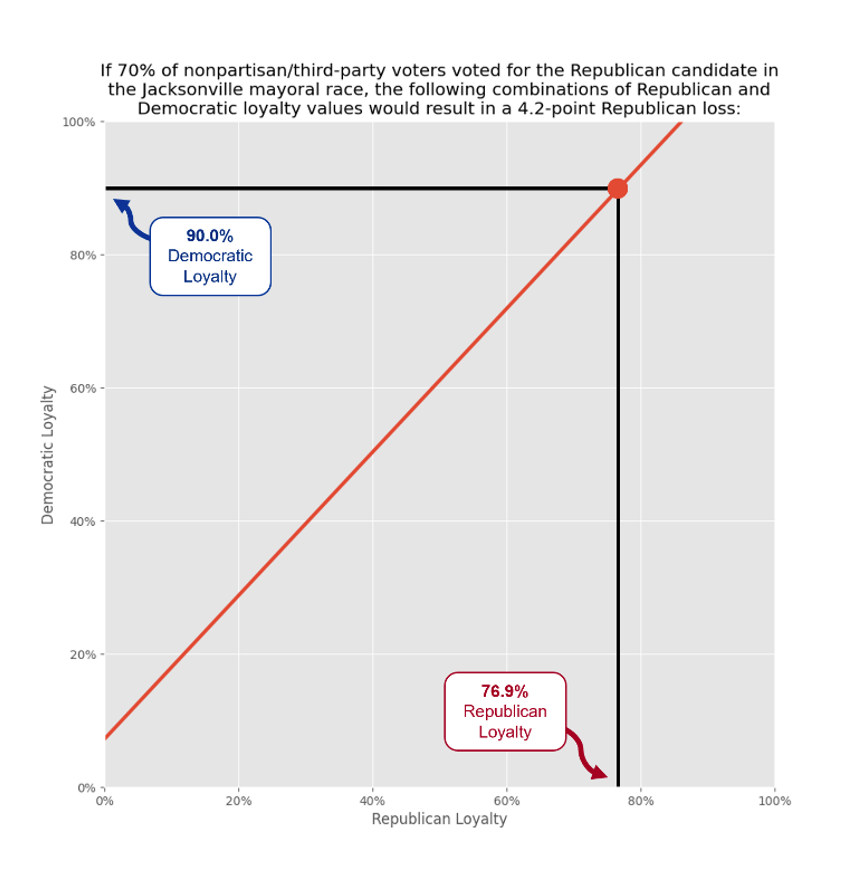
Each frame of the GIF shows which combinations of Democratic and Republican loyalty values would have resulted in Deegan’s 4.2-point victory, assuming some specific percentage (denoted in the title of each frame) of nonpartisan voters voted for Davis. The fact that the line moves upward as nonpartisan loyalty increases simply means that the higher the percentage of nonpartisan voters who voted for Davis, the greater the gap between Democratic loyalty and Republican loyalty must have been.
To illustrate this, let’s imagine that 70% of nonpartisan/third-party voters voted for Davis (i.e. 70% nonpartisan loyalty). In that case, Democratic loyalty must have outpaced Republican loyalty by between 7.2% and 13.8%, with most realistic possibilities towards the upper end of that spectrum. To drill down even further, let’s also imagine that Democratic loyalty was exactly 90%. In this case, Republican loyalty must have been just under 76.9%. This 13.1% gap means that Democratic voters were far more loyal to their party’s candidate than Republicans were. The chart below shows what that scenario looks like visually.
Now that we’ve viewed all of the possible scenarios that could have resulted in Deegan’s win, can we diagnose “what went wrong” for Republicans in Duval County? To an extent, yes. Our analysis finds that, in 65% of the scenarios, Democratic loyalty was stronger than Republican loyalty. And in 52% of the scenarios, nonpartisan loyalty was below 50%, meaning that nonpartisan and third-party voters sided with Deegan more than with Davis. In 100% of scenarios, at least one of these aforementioned factors were to blame for Davis’s loss, and in 17% of scenarios, both factors were at play.
While it’s impossible to know for sure, we can conclude that it’s more likely that Daniel Davis lost to Donna Deegan due to a lack of Republican loyalty than due to a lack of nonpartisan loyalty.
Naturally, the next question one might ask would be: “So how can Republicans fix this?” There are three routes to take here: raising Republican loyalty, raising nonpartisan loyalty, or decreasing Democratic loyalty.
First, it’s reasonable to assume that low candidate quality and nasty Republican primaries would result in a decrease in Republican loyalty. The Victory Formula shows that an increase in Republican loyalty of 4.61% or more would have handed Davis the victory. Perhaps clearing the primary election field and avoiding a nasty primary and/or drafting a more likeable candidate with existing countywide appeal (like Deegan had) could have achieved this goal.
Second, decreasing Democratic loyalty is easier said than done, but it requires winning over moderate Democrats. Either a “push” or “pull” strategy could work here. Davis could have “pushed” moderate Democrats away from Deegan by associating her with far left progressives and ideas like Defunding The Police, or he could have “pulled” moderate Democrats over to the Republican side by focusing on issues that resonate with moderates, like a strong economy or public safety. According to the Victory Formula, if Davis could have decreased Democratic loyalty by 4.97% or more, he would have won the race.
And finally, increasing nonpartisan loyalty can be done by any of the aforementioned strategies. The Victory Formula shows that an increase in nonpartisan loyalty of 16.35% or more would have guaranteed Davis the victory, holding everything else constant.
In a practical sense though, we all know that each of these factors influence one another. For example, if more Democrats are defecting to the Republican side (decreasing Democratic loyalty), it’s likely that more nonpartisans are, too (increasing nonpartisan loyalty). To run an effective campaign, outreach should be targeted with these things in mind. By uniting and energizing the Republican base, courting nonpartisans with common sense conservative policies, and fracturing the Democratic base, Republicans could avoid more heartbreaking losses like the 2023 Jacksonville mayoral race.
Meanwhile, here at Victory Insights, we’ll stick to doing what we do best: providing data-driven political insights.
Reach out to us
here with any questions.